Traditionally maps have helped us find our place in the world; they help us navigate and aid us in the planning and execution of a journey. With the continuing march of improvements in interaction design, they’ve also become in an incredibly useful tool for navigating stories, narratives and educating.
Often used as the basis for some eye-opening big data visualization, interactive maps allow people to explore their own neighborhood with new eyes, become intimate with far flung corners of the globe and see geographical trends in a neatly packaged and easy-to-grasp form.
They can also provide the foundations for plotting web documentaries or transmedia stories; an interactive pinboard for plotting out photographs video and various media. In the case of web documentaries, they can provide an almost literal roadmap for the narrative, guiding the viewer through the story while still giving them enough freedom to discover the different media on offer for themselves.
Last year was a great year for interactive maps with storytellers, journalists, documentary makers, social scientists and big data researchers all producing some incredible work. With that said, reducing this list to just five was very difficult indeed and if you think there are some glaring examples missing from our list, we’d love to hear your suggestions (after all, there’s always room for a sequel here at Submarine Channel). We love to hear from you, so leave us a comment below or get in touch via Twitter!
1.) Earth Wind Map
The US National Weather Service collects huge amounts of weather-related data, and while immensely useful, this data is not always easily available in a form that us non-meteorology experts can understand. Last year software engineer Cameron Beccario produced the mesmerizing Earth Wind Map, an interactive map that turns data collected by the US National Weather Service into a clickable and dragable globe that displays the world’s current wind patterns in near-real time.
2.) American Cities: Before and After
Last August, the Smithsonian Magazine published ‘American Cities: Before and After’, a simple yet hugely engaging idea. Focusing on the cities of New York, San Francisco and Chicago, the Smithsonian have created a series of interactive maps that allow you to compare the infrastructure of today with those of the mid-1800s. To do this they teamed up with map expert David Rumsey, a collector with more than 15,000 maps in his collection, and overlaid these historical maps with modern satellite photos. Before and After is a fascinating way for people to get a better understanding of how America’s biggest cities have evolved over the centuries and one that also gives a new-found appreciation for just how talented the cartographers of years ago really were.
3.) Wanderlust
Wanderlust is an interactive feature from GOOD Magazine that allows you to track some of history’s most famous journeys and routes – both real and fictional – on a world map. Whether it’s Emilia Earhart’s cross-navigation of the globe or the famous fictional road trip of Sal Paradise and Dean Moriarty in Kerouac’s 1957 novel On The Road, Wanderlust has plotted the numerous stops of each journey on an interactive map. Visitors to the site can then explore the pinned route, which in each case is accompanied with various entries about notable locations and photographs.
4.) Mars Curiosity Rover Tracker
Who said the maps have to be of our own planet? The New York Times is back again with an interactive app that allows you to track the entire route taken by NASA’s Curiosity rover on Mars. The route is shown on an interactive map of Mars, accompanied with a slew of information and a selection of some of the 36,700 photos Curiosity has sent home to Earth thus far. If you want to know more about tracking Curiosity’s journey across the Red Planet, then this fascinating article from mapbox’s Chris Herwig is definitely worth your time.
5.) Google Chrome Experiments: Build with Chrome
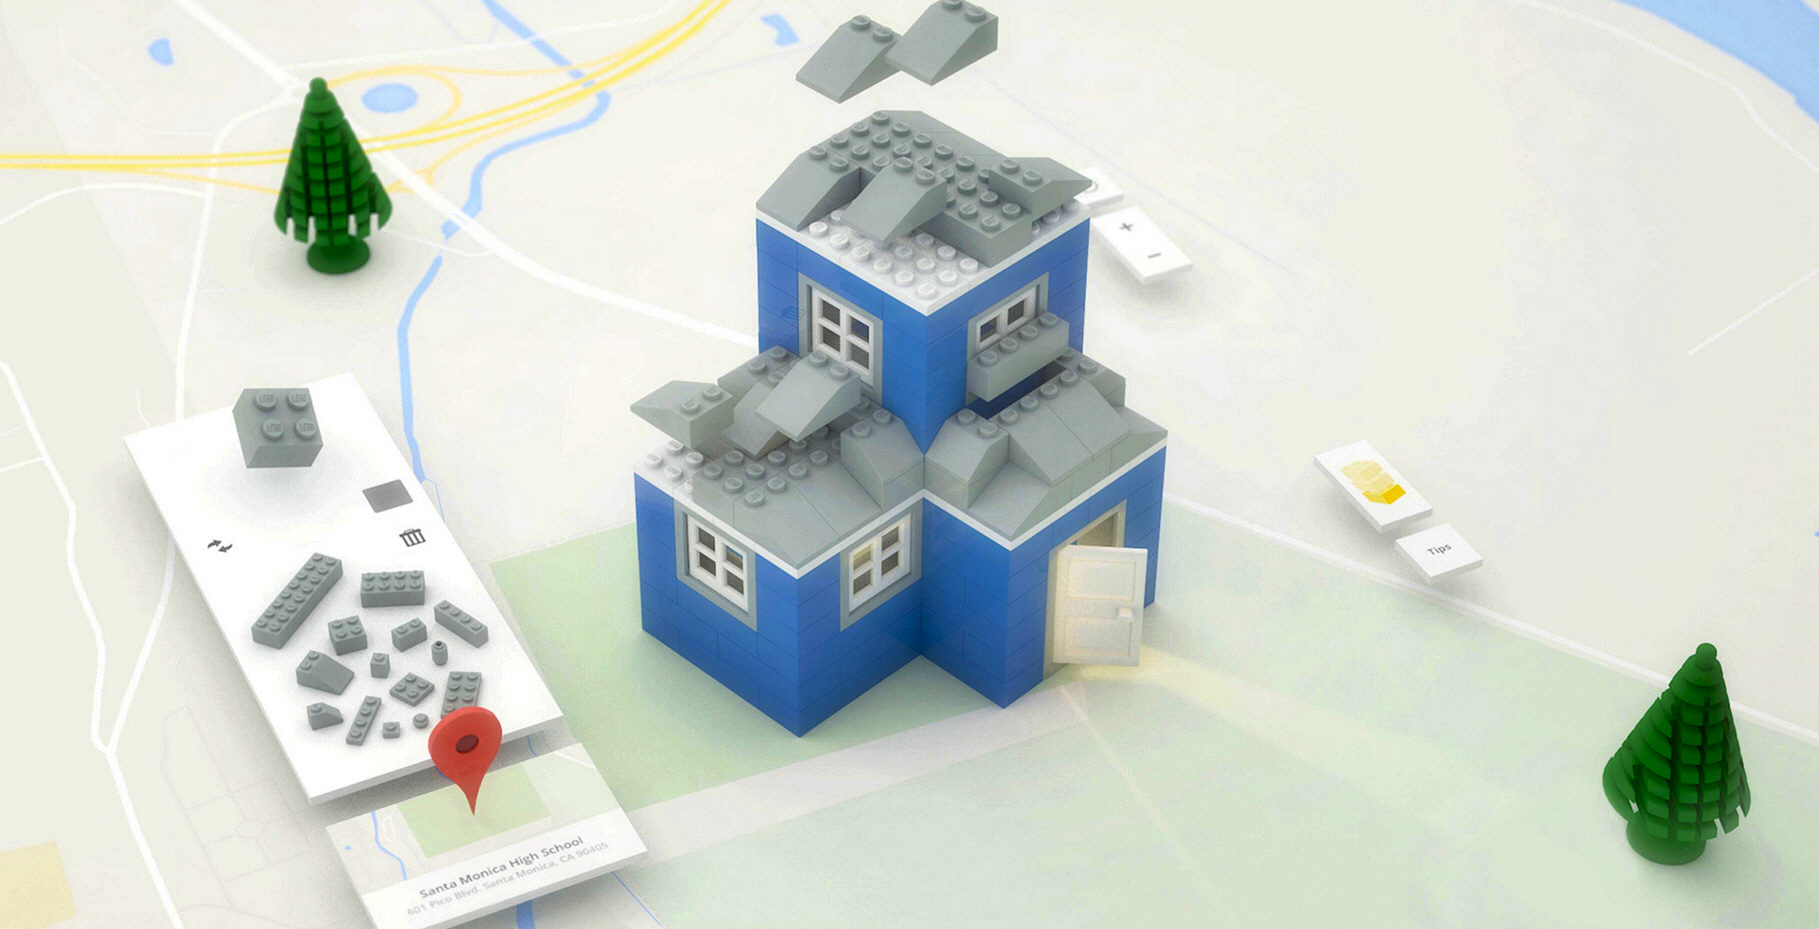
And now for something completely different. Google and LEGO teamed up last year to produce Build with Chrome – a browser-based tool that allows you to build your own Lego creations and then place them in the real world. What started out as a Chrome Experiment, Lego Builder features a world map that allows you to discover the creations of Lego-lovers across the globe. Build With Chrome can be accessed on any browser enabled with WebGL, including Safari, Firefox, and mobile browsers. Kiss goodbye to your productivity.
 Submarine Channel


